KEY PERFORMANCE INDICATOR (KPI)
Definition
A Key Performance Indicator (KPI) is a quantifiable metric used to evaluate how effectively an individual, team, or organization is achieving its strategic and operational goals. KPIs provide real-time insights into business performance and support decision-making at all levels.
In short: KPIs turn strategy into measurable results.
Origins
The concept of KPIs stems from management accounting and performance measurement systems developed in the 20th century (e.g., Peter Drucker’s Management by Objectives). The term became widely adopted with the rise of balanced scorecards (Kaplan & Norton, 1992) and performance dashboards in modern business intelligence systems.
Usage
Industry Applications:
-
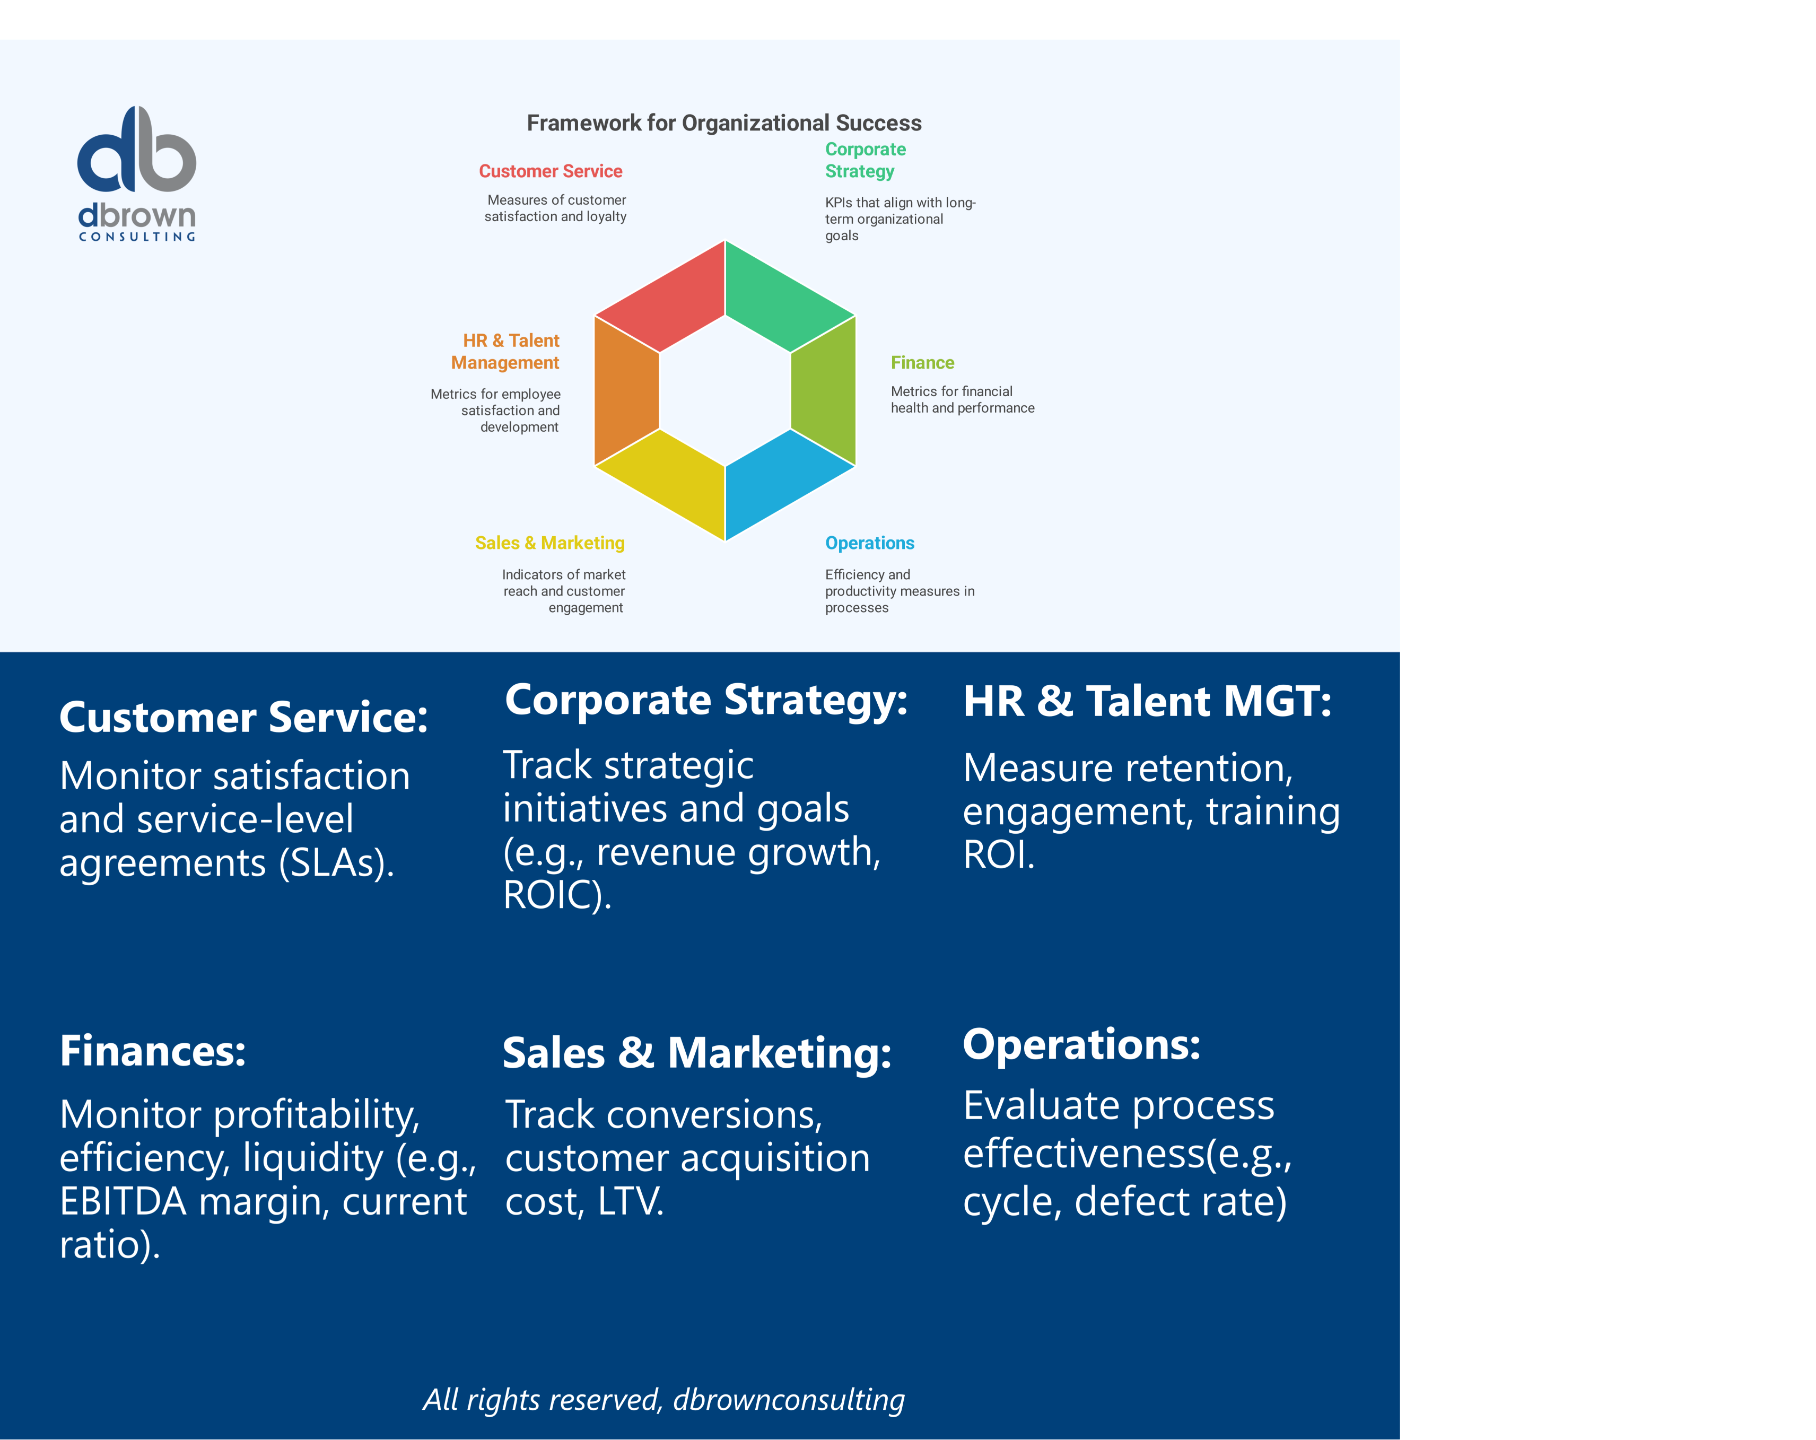
Corporate Strategy – Track strategic initiatives and goals (e.g., revenue growth, ROIC).
-
Finance – Monitor profitability, efficiency, liquidity (e.g., EBITDA margin, current ratio).
-
Operations – Evaluate process effectiveness (e.g., cycle time, defect rate).
-
Sales & Marketing – Track conversions, customer acquisition cost, LTV.
-
HR & Talent – Measure retention, engagement, training ROI.
-
Customer Service – Monitor satisfaction and service-level agreements (SLAs).
How KPI Works
KPI Framework:
-
Define Business Objective
→ e.g., Improve profitability -
Select KPI(s)
→ e.g., Net Profit Margin, Gross Margin -
Set Targets
→ SMART (Specific, Measurable, Achievable, Relevant, Time-bound) -
Measure & Monitor
→ Periodic reporting via BI dashboards or scorecards -
Analyze & Optimize
→ Use variance analysis and trends to drive decisions
Key Takeaway
-
KPIs align tactical execution with strategic goals.
-
Must be actionable, relevant, and measurable.
-
Different functions and industries require tailored KPIs.
-
Effective KPIs drive accountability, performance reviews, and improvement.
Types of Asset
| Type | Description |
|---|---|
| Leading KPIs | Predict future outcomes (e.g., sales pipeline). |
| Lagging KPIs | Measure past performance (e.g., revenue, churn). |
| Quantitative KPIs | Numerically measurable (e.g., ROA, EBITDA). |
| Qualitative KPIs | Subjective metrics (e.g., brand sentiment). |
| Strategic KPIs | Track long-term business goals. |
| Operational KPIs | Focus on day-to-day performance. |
Context in Financial Modeling
KPIs directly feed into:
-
Dashboards and management reports
-
Variance and trend analysis
-
Scenario planning and forecasting
-
Valuation models (e.g., revenue growth %, EBITDA margin)
-
Covenant monitoring in financing agreements
-
Performance-based compensation and bonus structures
Example KPIs in financial models:
-
Revenue CAGR
-
Gross Margin %
-
EBITDA Margin
-
Return on Equity (ROE)
-
Working Capital Days
-
Debt/EBITDA Ratio
Nuances & Complexities
-
KPI ≠ Metric: Every KPI is a metric, but not every metric is a KPI. KPIs are the most critical metrics.
-
KPI Overload: Too many KPIs dilute focus. Use 5–10 critical ones per business unit.
-
Benchmarking: KPIs gain context through industry standards or historical performance.
-
Visualization: KPIs should be easy to interpret via dashboards or traffic-light systems.
-
Reassessment: KPIs must evolve with strategy, industry trends, and market conditions.
Mathematical Formulas
1. Net Profit Margin:
2. Customer Acquisition Cost (CAC):
3. Inventory Turnover:
4. Churn Rate:
Master Financial Modeling with the FMA
Change your career today by earning a Globally Recognized Accreditation
Develop real-world financial modeling skills, gain industry-recognized expertise, stand out and start earning more by gaining the Advanced Financial Modeler (AFM) designation from the Financial Modeling Institute.
Our expert-led online cohort based program covers everything you need to become a world class financial modeling pro and advance your career in finance.
Related Terms
-
Metric
-
OKR (Objectives & Key Results)
-
Balanced Scorecard
-
Business Intelligence (BI)
-
Dashboards
-
Benchmarking
-
Variance Analysis
-
Performance Management
Real-World Applications
1. SaaS Business Metrics
Tracks KPIs like Monthly Recurring Revenue (MRR), Churn Rate, Customer Lifetime Value (LTV), and CAC to guide growth strategy.
2. Manufacturing Plant
Uses KPIs such as Yield %, Overall Equipment Effectiveness (OEE), and Downtime Hours to optimize productivity.
3. Financial Services
A bank monitors Net Interest Margin (NIM), Cost-to-Income Ratio, and Non-Performing Loan Ratio to manage profitability and risk.
4. Human Resources
Tracks Time to Hire, Retention Rate, Employee Satisfaction (eNPS) to align workforce strategy with company goals.
References & Sources
Unlock the Language of Finance!
Elevate your financial acumen with DBrown Consulting’s exclusive newsletter. We break down complex finance terms into clear, actionable insights—empowering you to make smarter decisions in today’s markets.
Subscribe Today & Make Financial Jargon Simple!
We won't send spam. Unsubscribe at any time.
