LEVERAGE RATIO
Definition
A leverage ratio is a financial metric that measures the proportion of a company’s debt relative to its equity, assets, or earnings. It is also known as a 'gearing ratio' in the UK and other regions.
Leverage ratios are key tools in credit analysis, banking regulation, and corporate finance. Higher leverage typically means greater financial risk but also potential for higher returns to equity holders.
Origins
The term "leverage" comes from the mechanical concept of a lever, using a small force to move a larger object. In finance, leverage describes using borrowed capital to amplify returns. The formal use of leverage ratios in corporate finance became widespread in the mid-20th century with the rise of modern credit analysis and capital markets.
Usage
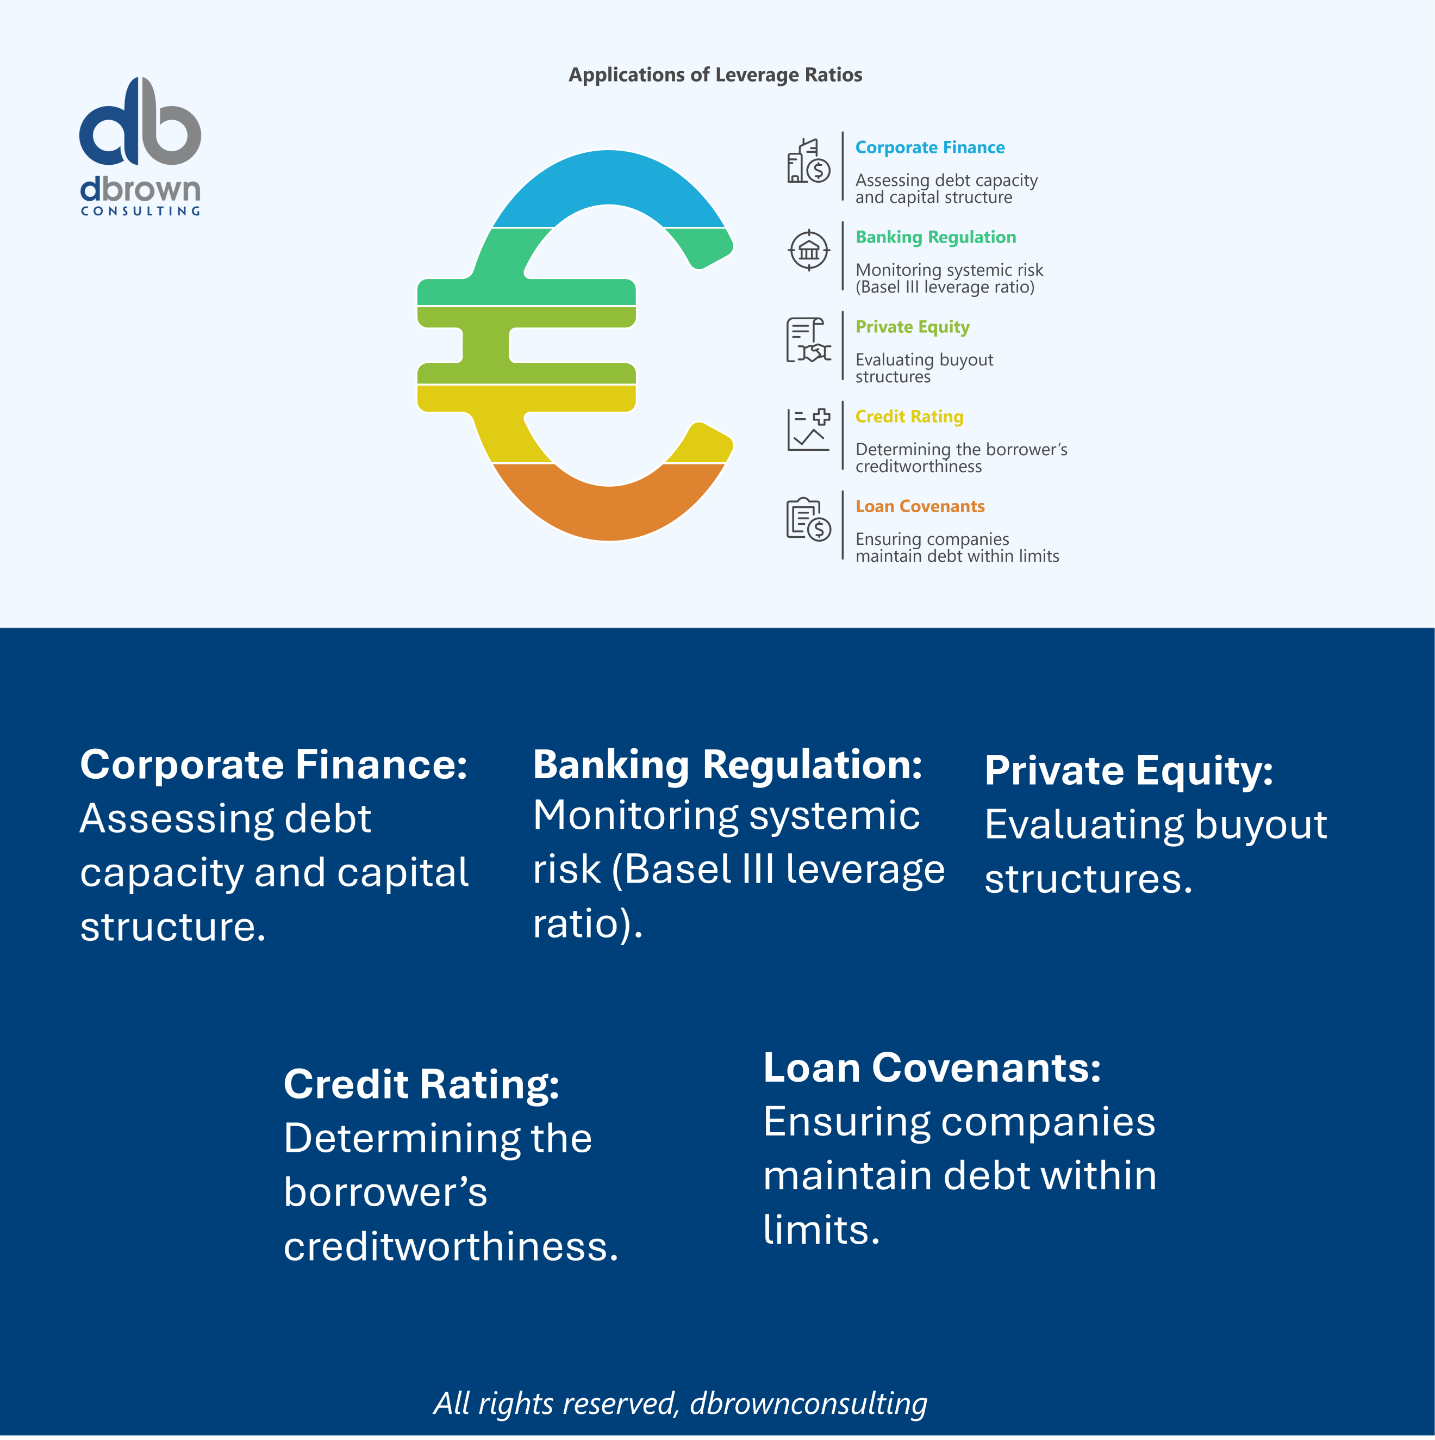
Leverage ratios are used in:
-
Corporate finance – Assessing debt capacity and capital structure.
-
Banking regulation – Monitoring systemic risk (Basel III leverage ratio).
-
Private equity – Evaluating buyout structures.
-
Credit rating – Determining the borrower’s creditworthiness.
-
Loan covenants – Ensuring companies maintain debt within limits.
How Leverage Ratios Works
-
Numerator: Usually total debt or liabilities (sometimes only interest-bearing debt).
-
Denominator: Usually equity, assets, or a combination of both.
-
Interpretation: Higher ratios = greater reliance on debt financing.
-
Industry Benchmarks: Acceptable leverage varies widely by sector.
Types of Loan Covenants
Different leverage ratios serve different analytical purposes:
1. Debt-to-Equity Ratio (D/E)
Measures how much debt a company uses compared to equity.
2. Debt-to-Assets Ratio
Shows the proportion of assets financed by debt.
3. Debt-to-Capital Ratio
Measures debt as a proportion of total capital (debt + equity).
4. Interest Coverage Ratio
Indicates ability to pay interest from earnings.
5. Basel III Leverage Ratio (Banking)
A non-risk-based measure of capital adequacy.
Key Takeaway
-
Measures financial risk and debt reliance.
-
Can be calculated using book or market values.
-
Common in loan covenants and credit risk models.
-
Higher leverage increases potential returns and risk of default.
Context in Financial Modeling
Leverage ratios are used in:
-
Valuation models (DCF, LBO) – Impact WACC and equity returns.
-
Scenario analysis – Testing sensitivity to interest rate changes.
-
Banking stress tests – Regulatory capital adequacy checks.
-
Covenant compliance – Ensuring leverage stays below agreed thresholds.
Nuances & Complexities
-
Off-Balance Sheet Liabilities – Leases, guarantees can distort ratios.
-
Debt Definition Variance – Some calculations exclude non-interest-bearing liabilities.
-
Market vs. Book Values – Market-based leverage ratios reflect investor perception better.
-
Cyclicality – Ratios can spike during downturns due to falling equity values.
Mathematical Formulas
Example: Debt-to-Equity
Company has:
-
Total Debt = $500M
-
Total Equity = $250M
Interpretation: Company uses $2 debt for every $1 equity.
Example: Interest Coverage
-
EBIT = $120M
-
Interest Expense = $30M
Interpretation: Earnings cover interest expense 4 times.
Master Financial Modeling with the FMA
Change your career today by earning a Globally Recognized Accreditation
Develop real-world financial modeling skills, gain industry-recognized expertise, stand out and start earning more by gaining the Advanced Financial Modeler (AFM) designation from the Financial Modeling Institute.
Our expert-led online cohort based program covers everything you need to become a world class financial modeling pro and advance your career in finance.
Related Terms
-
Debt Ratio
-
Capital Structure
-
Gearing Ratio
-
Interest Coverage Ratio
-
Debt Covenant
-
Financial Risk
Real-World Applications
Example 1: Private Equity LBO
An LBO target has a Debt/EBITDA ratio of 5× post-acquisition, with covenants requiring it to fall below 3× in three years.
Example 2: Banking Regulation
Basel III requires large banks to maintain a minimum 3% Tier 1 leverage ratio to limit excessive borrowing.
Example 3: Corporate Finance
A manufacturing firm maintains a 0.8 Debt-to-Equity ratio to keep borrowing costs low while financing expansion.
References & Sources
Unlock the Language of Finance!
Elevate your financial acumen with DBrown Consulting’s exclusive newsletter. We break down complex finance terms into clear, actionable insights—empowering you to make smarter decisions in today’s markets.
Subscribe Today & Make Financial Jargon Simple!
We won't send spam. Unsubscribe at any time.
