SHARPE RATIO
Definition
The Sharpe Ratio is a measure of risk-adjusted return developed by Nobel laureate William F. Sharpe. It quantifies how much excess return an investment generates for each unit of risk taken, where risk is measured by the standard deviation of returns.
It is widely used in portfolio management, performance evaluation, and investment comparison.
Origins
-
Named after William F. Sharpe, who introduced the concept in 1966.
-
Initially called the "reward-to-variability ratio" before being renamed in 1994.
-
Rooted in Modern Portfolio Theory (MPT), which emphasizes the trade-off between risk and return.

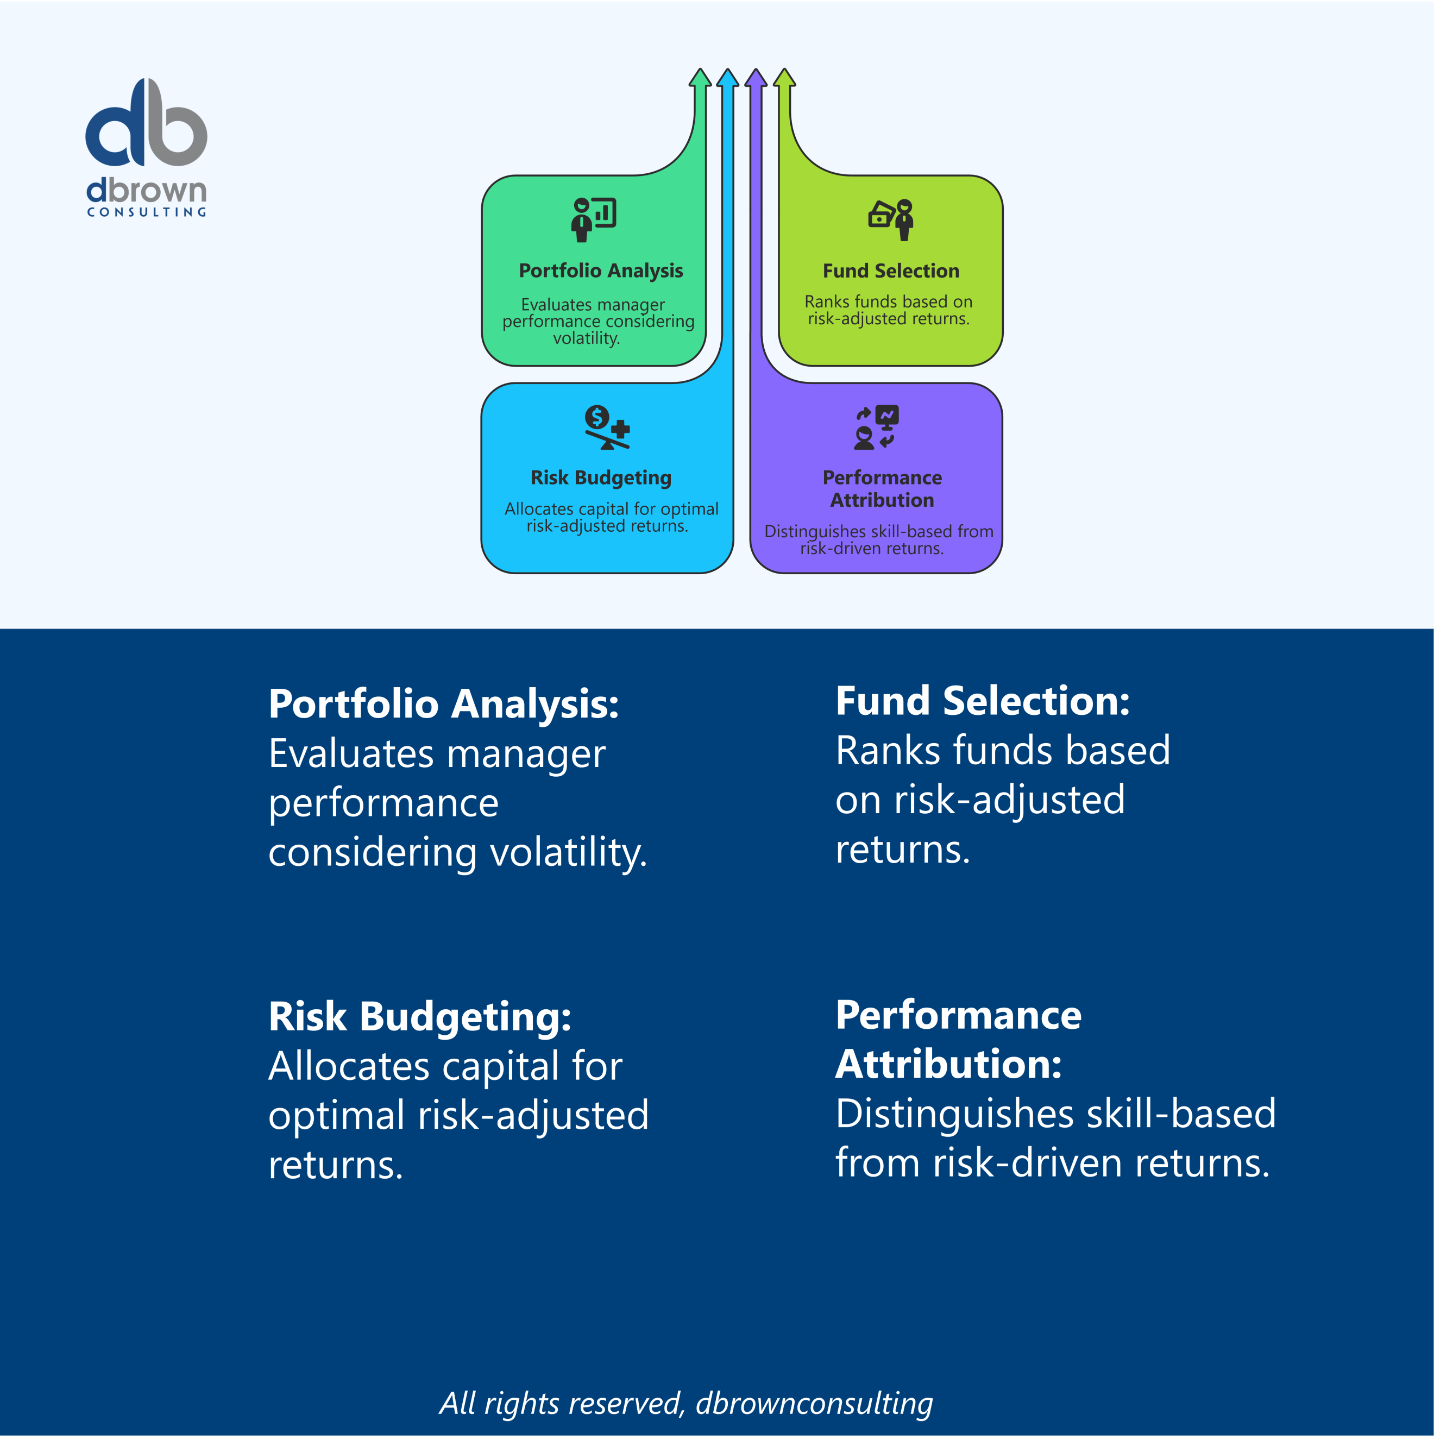
Usage
-
Portfolio analysis – Compare managers’ performance adjusting for volatility.
-
Fund selection – Rank mutual funds, ETFs, or hedge funds.
-
Risk budgeting – Allocate capital to strategies with higher risk-adjusted returns.
-
Performance attribution – Separate return due to skill from return due to risk-taking.
How the Sharpe Ratio Works
-
Calculate excess return – Subtract the risk-free rate from the investment’s average return.
-
Measure volatility – Find the standard deviation of the investment’s returns.
-
Divide excess return by volatility – Higher ratio means better risk-adjusted performance.
Types & Variations
-
Ex-Ante Sharpe Ratio – Uses expected future returns.
-
Ex-Post Sharpe Ratio – Based on historical returns.
-
Modified Sharpe Ratio – Adjusts for skewness and kurtosis in returns.
-
Information Ratio – Similar concept but uses benchmark excess return instead of risk-free rate.
Key Takeaway
-
Higher Sharpe Ratio = Better risk-adjusted performance.
-
A Sharpe Ratio > 1 is generally good, > 2 is very good, and > 3 is excellent.
-
Negative Sharpe Ratios indicate underperformance relative to the risk-free rate.
-
Works best for normally distributed returns—less accurate for asymmetric return profiles.
Context in Financial Modeling
-
Portfolio optimization – Maximize Sharpe Ratio for efficient frontier construction.
-
Risk-adjusted valuation – Compare investment strategies with varying risk levels.
-
Performance reporting – Industry standard in hedge fund and mutual fund marketing.
Nuances & Complexities
-
Not suitable for all strategies – Fails to capture tail risks or illiquidity effects.
-
Timeframe sensitivity – Annualizing short-term Sharpe Ratios can be misleading.
-
Non-normal distributions – Hedge funds with options strategies may appear artificially high.
-
Choice of risk-free rate – Impacts final calculation.
Mathematical Formulas
Where:
-
= Expected return of the portfolio or asset
-
= Risk-free rate (e.g., U.S. Treasury yield)
-
= Standard deviation of portfolio returns (risk)
Master Financial Modeling with the FMA
Change your career today by earning a Globally Recognized Accreditation
Develop real-world financial modeling skills, gain industry-recognized expertise, stand out and start earning more by gaining the Advanced Financial Modeler (AFM) designation from the Financial Modeling Institute.
Our expert-led online cohort based program covers everything you need to become a world class financial modeling pro and advance your career in finance.
Related Terms
-
Information Ratio
-
Sortino Ratio
-
Treynor Ratio
-
Modern Portfolio Theory (MPT)
-
Efficient Frontier
-
Risk-Adjusted Return
Real-World Applications
Example 1: Mutual Fund Example 2: Hedge Fund
-
Annual return = 10%
-
Risk-free rate = 2%
-
Std. deviation = 12%
-
Sharpe Ratio = → Below average.
Example 2: Hedge Fund
-
Annual return = 15%
-
Risk-free rate = 3%
-
Std. deviation = 6%
-
Sharpe Ratio = → Excellent.
References & Sources
Unlock the Language of Finance!
Elevate your financial acumen with DBrown Consulting’s exclusive newsletter. We break down complex finance terms into clear, actionable insights—empowering you to make smarter decisions in today’s markets.
Subscribe Today & Make Financial Jargon Simple!
We won't send spam. Unsubscribe at any time.
