COMMON SIZING
Definition
Common sizing (or common-size analysis) is a financial analysis technique that expresses each line item in a financial statement as a percentage of a base figure, facilitating comparability across time periods, companies, or industries regardless of size. It is most commonly applied to income statements and balance sheets.
In the income statement, items are expressed as a percentage of total revenue.
In the balance sheet, items are expressed as a percentage of total assets.
Origins
The term "common sizing" stems from the idea of putting financial data on a "common scale" to normalize it for easier comparison. This technique became popular in the early 20th century as part of comparative ratio analysis, especially in corporate finance and accounting.
Usage
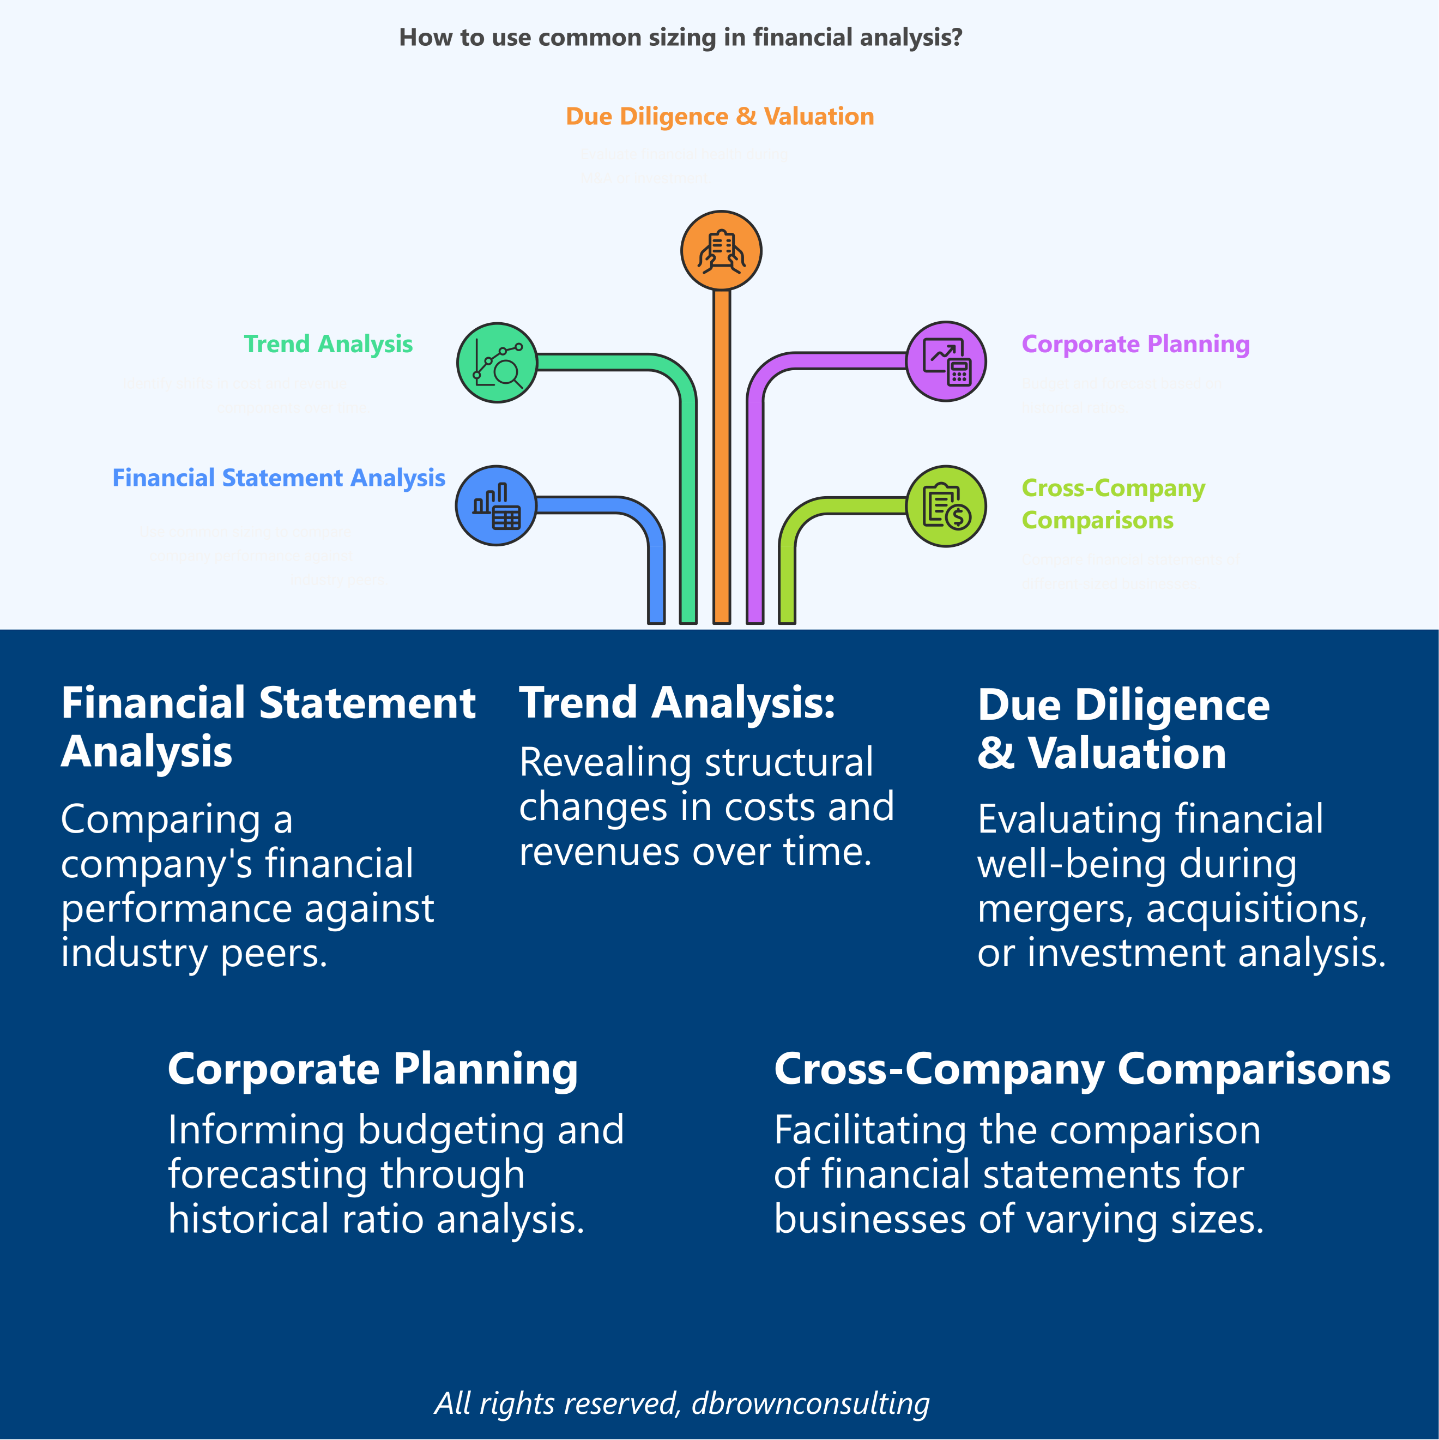
Common sizing is used extensively in:
-
Financial Statement Analysis: Benchmarking company performance against peers.
-
Trend Analysis: Identifying structural shifts in cost and revenue components over time.
-
Due Diligence & Valuation: Evaluating financial health during M&A or investment.
-
Corporate Planning: Budgeting and forecasting based on historical ratios.
-
Cross-Company Comparisons: Comparing financial statements of businesses of different sizes.
How Common Sizing Works
The process involves converting absolute dollar figures into relative percentages using a base item:
1. Income Statement Common Sizing
Each item is expressed as a percentage of total revenue:
Example:
-
Revenue: $1,000,000
-
COGS: $400,000
-
Operating Expenses: $300,000
-
Net Income: $200,000
Common-size income statement:
-
COGS: 40%
-
Operating Expenses: 30%
-
Net Income: 20%
2. Balance Sheet Common Sizing
Each item is expressed as a percentage of total assets:
Example:
-
Total Assets: $5,000,000
-
Cash: $500,000
-
Inventory: $1,000,000
-
Long-term Debt: $2,000,000
Common-size balance sheet:
-
Cash: 10%
-
Inventory: 20%
-
Long-term Debt: 40%
Key Takeaway
-
Common sizing standardizes financial data for easier analysis.
-
Percentages reveal insights about financial structure and performance trends.
-
It helps analysts compare across companies regardless of absolute size.
-
It's a key input for ratio analysis, benchmarking, and strategic planning.
Types of Option
1. Vertical Analysis
-
A form of common sizing within a single period.
-
Shows the proportion of each item relative to a base figure (e.g., total revenue).
2. Horizontal Analysis (Trend Analysis)
-
Combines common sizing over multiple periods to track changes over time.
3. Cross-Sectional Analysis
-
Comparing common-sized statements of different firms within the same industry.
4. Forecasted Common Size Statements
-
Used in financial modeling to project future statements based on historical percentages.
Context in Financial Modeling
Common sizing is essential in:
-
Forecasting future income statements and balance sheets.
-
Creating assumptions in discounted cash flow (DCF) models.
-
Evaluating cost structure stability over time.
-
Normalizing data for comparables analysis (used in valuation multiples like EV/EBITDA).
Nuances & Complexities
-
Industry Norms Vary: What’s typical in one industry (e.g., high gross margins in software) may not apply in another (e.g., retail).
-
Inflation & FX Effects: Inflation or currency changes can distort trends if not adjusted.
-
One-Time Events: Non-recurring items can skew common size metrics.
-
Scaling Limitations: Expressing large values as percentages can mask material dollar changes.
Mathematical Formulas
1. Income Statement:
2. Balance Sheet:
Master Financial Modeling with the FMA
Change your career today by earning a Globally Recognized Accreditation
Develop real-world financial modeling skills, gain industry-recognized expertise, stand out and start earning more by gaining the Advanced Financial Modeler (AFM) designation from the Financial Modeling Institute.
Our expert-led online cohort based program covers everything you need to become a world class financial modeling pro and advance your career in finance.
Related Terms
-
Trend Analysis
-
Financial Modeling
-
Comparables Analysis
-
EBITDA Margin
-
Vertical & Horizontal Analysis
Real-World Applications
Example 1: Industry Benchmarking
Two companies:
-
Company A has COGS at 40% of revenue, while Company B’s is 60%. The higher ratio for B may indicate lower operational efficiency.
Example 2: Longitudinal Analysis
A business sees SG&A as a percentage of revenue drop from 25% to 18% over 3 years — a sign of improving scalability.
Example 3: M&A Due Diligence
Analysts compare the target's common-size financials to industry medians to evaluate synergies and risk.
References & Sources
Unlock the Language of Finance!
Elevate your financial acumen with DBrown Consulting’s exclusive newsletter. We break down complex finance terms into clear, actionable insights—empowering you to make smarter decisions in today’s markets.
Subscribe Today & Make Financial Jargon Simple!
We won't send spam. Unsubscribe at any time.
