March 30, 2022
Building a Data Analytics System: 6 Key Questions, Answered
A good company knows who they want to sell to. A great company knows what their customers like. But a successful company can drill down their customer data to exactly when, what, where, why, and how their customers are buying. They know personas; they know pain points; they know the problem their product solves and what combination of products/services works best for their customers.
And how do they know all this? Data.

A powerful data analytics system is key to a successful company. Robust datasets collected during the sales process mean more answers to questions your company’s C-suite is going to ask down the line. But building that system? It takes a little more than a simple sales dashboard or downloadable data tools. Your organization should be planning across departments to be asking the right questions. To get you started, we pulled together some of the most common questions we help partners answer as they build their data analytics systems.
#1: What Is a Data Analytics System?
A data analytics system is a robust, powerful tool that allows its users to interpret data to help them make business decisions. It’s purpose is to bridge the gap between siloed data in multiple departments within your company, help employees get complex data questions answered, and simplify the data reporting and analysis process to save employees time. It should be automated, pull data from several sources within your company, and provide a rounded picture of the overall health of the company, inside and out.
Successful Data Analytics Systems are those built and updated by the users of the analytics, that way, the system always works to enhance the user’s knowledge of what is happening in the business. The system must use modern techniques including natural language queries that accept and respond to simple questions of the data. The best systems integrate so well they are unnoticed, they just work.
#2: Is a Data Analytics System the Same as a Reporting System?
First, myth-busting: a data analytics system is not the same as an operating, or reporting, system.
Many companies sell operational systems (OS) that have attached analytics features. But these analytics features are not analytics systems – they’re reporting on siloed data collected by that specific OS. They just tell you what is happening.
By contrast, analytics systems combine data from multiple sources. The data from various OS’s and other data sources is the key part of this system, the relationships between these data sources helps explain why things happen, giving richer insights to aid the decision making process. So the richer and more diverse the data collected about a transaction, the more contextual the information the more powerful your analytic system will be.
Put simply: Operation Systems execute a business process and the Reports from this system are basic, whereas Analytics Systems evaluate a business process and can produce extraordinarily powerful insights on your data. Moreover, analytics systems should make it easy for you to recognize patterns.
To learn more, check out our related post, What is the Difference Between Reporting and Analytics.
#3: Who Should Have Access to Data Analytics Systems?
The short answer: everyone.
Traditionally, company data has been gatekept by departments like IT. It makes sense: in order to keep company data secure, IT departments kept the keys. But more and more, companies are realizing that alignment is essential to business growth. It can:
– Improve customer experience and provide a 360-degree view of the customer journey
– Increase decision-making speed
– Optimize each and every person’s role at the company
– Help each person and team understand their role in the eyes of the customer
Let’s be clear: IT departments should be able to own the OS where data is generated. Analytics systems, on the other hand, should be owned by the users, the people who collect that data day in and day out and own the process of evaluating that data. Think about departments like HR, finance and accounting, sales, product development, and so on. Data is generated in Each department needs to access its own data analytics system for the data they need; the data that is connected to and generated in their Operating Systems.
Additionally, the C-suite requires the bigger picture. Executives need to have access to one large hub of departmental analytic systems in order to see what is happening throughout the entire organisation.
When data analytics are done this way, it’s an all-around win for your organization. IT no longer has to waste time downloading and sending out data that’s requested. Siloed departments don’t have to keep asking the same questions again and again. And company executives can get a birds-eye view of the entire business at any time – ultimately leading to better business decisions.
#4: What Should a Data Analytics System Be Able to Tell You?
We’ve already mentioned it a couple times, but it bears repeating: your data analytics system should be able to tell you give you rich contextual information about your business. This information will be different across your departments, for example:
– Your sales analytics system should be able to tell you:
– What customers are buying.
– Sales by Demographics: gender, age, race, etc.
– When and where they are buying that product and on what device.
– Detailed comparisons over time and targets by multiple categorical subdivisions.
– Your HR analytics system should be able to tell you:
– Who is performing & who might not be in the coming months.
– The overall level of engagement & retention.
– About time tracking and workforce productivity.
– The effectiveness of training, etc.
– Your accounting analytics system should be able to tell you:
– Predictive analytics, like financial projections, based on sales data.
– Where you might be wasting money.
– Core financial ratios and their trend over time.
– Cost-benefit analysis.
– And your overall organisational dashboard should be able to:
– Show visually what is working within and outside of the company.
– Show the C-suite the highs and lows by multiple metrics.
– Answer specific and complex business questions.
In order for a system to be this robust, you need to have strong data reporting practices in place at your company. Build a data-focused culture that encourages folks to drill deep into interactions within their departments and to think critically about customer-centric questions.
#5: What Data Analytics Tool Should I Use?
There are a LOT of data analytics tools out there. A good system:
– Should be easy to use and easy to collaborate on
– Should offer strong and clear visuals and ideally have a dashboard option
– Should be able to answer language-based queries (i.e., users should be able to type in a specific question, and the system should be able to accurately generate an answer)
– Should have a really easy formula language to enable complex queries of the system
– Should incorporate modern security features
– Should integrate Artificial Intelligence features that allow you see patterns in your data
– Should be able to connect to multiple data sources
– And it should be easily automated
That last one is crucial. Employees in charge of reporting and presenting data are often wasting hours, pulling, and cleaning data. A good data analytics system should completely cut out that part of their job so they can spend most of their time interpreting the data to help make business decisions.
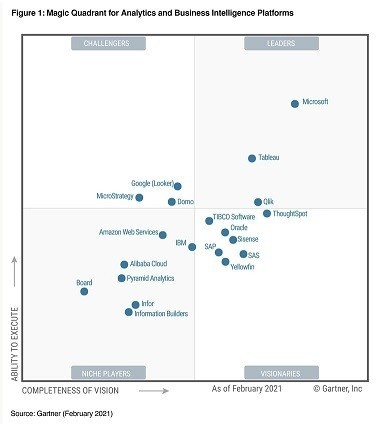
We usually recommend Power BI as the analytics system of choice. Microsoft is ubiquitous, and the Power BI platform is extremely robust and powerful, and the system has been named a leader in the data analytics industry for 14 consecutive years by Gartner.
#6: How Do I Get Started?
By reading this, you’re already rolling! Building a good system takes company alignment and serious strategy. You should be clear about the goals you want to accomplish and the vision of the company. From there, create a data strategy:
– Audit the data you already have on file (think of all the downloaded CSVs in your email history, the data your OS is currently collecting, and the multitude of adhoc data sources you usually cobble together to create those time bound reports)
– Organize this data into tables that show what, where, when, who and how a transaction happened. These transactions depend on the data of interest for each department. e.g. customer sales data, people data, salary, transactions and more.
– Focus on the users’ needs in the planning process. Ask: what do you want to know? What data are you pulling monthly? What processes are wasting your time?
– Think about the company’s future goals. How can you center that in how your system gets built?
We always recommend asking for help as you build. At dbrownconsulting, we’ve helped hundreds of companies build and adjust their analytics systems – and trained thousands of employees across the world on how to own their data reporting and analytics. Does your company need a helping hand? Don’t hesitate to contact us.
Connect with us
30.1k Subscribers
