Exploring the Power BI Visuals Marketplace: Unlock Hidden Gems for Your Reports
Oct 20, 2025
Power BI comes with a rich set of built-in visuals like bar charts, pie charts, and line graphs. But what if you need something more specialized; like a word cloud, or heatmap? That is where the Power BI Visuals Marketplace comes in.
In this post, we will explore what the Visuals Marketplace is, why it matters, and how you can use it to take your reports from simple to stunning.
What is the Power BI Visuals Marketplace?
The Marketplace is an online library of custom visuals developed by Microsoft and third-party creators. It allows you to:
- Extend your reporting capabilities beyond default visuals.
- Access visuals tailored for specific industries or needs.
- Enhance storytelling with innovative, interactive charts.
How to Access the Marketplace
- Open Power BI Desktop.
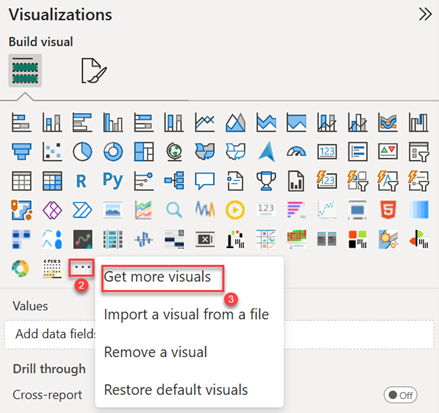
- In the Visualizations pane, click the three-dot (…) menu.
- Select Get more visuals.
-
Browse or search for visuals directly in the Marketplace.
Explore the Power BI Visuals Marketplace to find custom charts and hidden tools. Dramatically improve your reports, visualization, and data storytelling instantly.
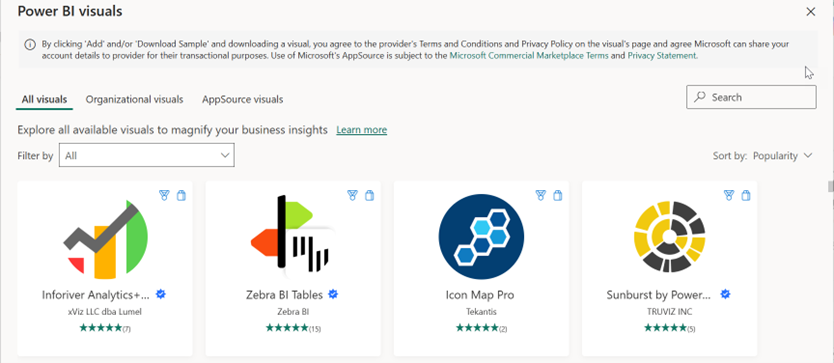
Popular Custom Visuals to Try
- Inforiver Analytics+ – Financial reporting, planning, forecasting, and variance analysis.
- ZebraBI Tables – Professional, IBCS-compliant financial tables and charts.
- Icon Map Pro – Advanced geospatial analysis with custom shapes.
- Sunburst by Powerviz – Visualizing hierarchical data in a circular layout.
- Word Cloud – highlight frequently occurring words.
Benefits of Using Marketplace Visuals
- Enhanced User Engagement: Interactive and intuitive visuals.
- Industry-Specific Needs: Tools for finance, marketing, HR, etc.
- Faster Insights: More precise visualization of complex data.
Best Practices
- Don’t overload your reports with too many custom visuals.
- Vet third-party visuals for performance and trustworthiness.
- Use certified visuals where possible for added reliability.
Conclusion
The Power BI Visuals Marketplace is like an app store for your reports. Explore it, experiment, and discover visuals that can make your dashboards not just informative, but also unforgettable.

